Science practical skills
Which variable goes on the x-axis in a science graph?
The variable you deliberately change usually belongs on the x-axis. The variable you measure in response usually belongs on the y-axis.
Published

Start with the experiment, not the blank axes
A graph becomes easier when the learner first says what happened in the investigation. Ask two questions: what did we choose to change, and what did we measure after each change? The answer to the first question is the independent variable. The answer to the second is the dependent variable.
Imagine an investigation that changes water temperature and measures how long a tablet takes to dissolve. Temperature is chosen by the experimenter, so it belongs on the horizontal x-axis. Dissolving time is measured in response, so it belongs on the vertical y-axis. This remains true even if the results table lists the columns in a confusing order.
Both people in the opening AI-generated photograph are fictional; the graph-learning scene is not a real session and implies no school relationship.
Use a sentence frame when the labels feel abstract
Complete this sentence before drawing: “I changed ___ and measured ___.” Put the first blank on x and the second on y. The words independent and dependent can then be attached to a decision the student already understands.
There are exceptions in specialist contexts, and some software may arrange a display differently. For ordinary school investigations, however, change on x and measure on y is the useful default. If a paper gives an unfamiliar convention, follow the wording and example in that paper.
| Investigation | X-axis: changed | Y-axis: measured |
|---|---|---|
| Light and plant growth | Hours of light each day | Increase in plant height |
| Pendulum length and time | Length of the pendulum | Time for a set number of swings |
| Concentration and reaction | Solution concentration | Reaction time or reaction rate |
Label the quantity and the unit separately
An axis label needs enough information for another person to interpret every point. Write the quantity and its unit, for example “temperature / °C” or “time / s”. Do not attach a unit to a quantity that has none, and do not repeat the unit beside every tick number.
Check that the unit matches the results table before plotting. Converting minutes to seconds halfway through a graph changes the scale. If a conversion is needed, convert the whole column first and label the final unit once.
Choose a scale that uses the page well
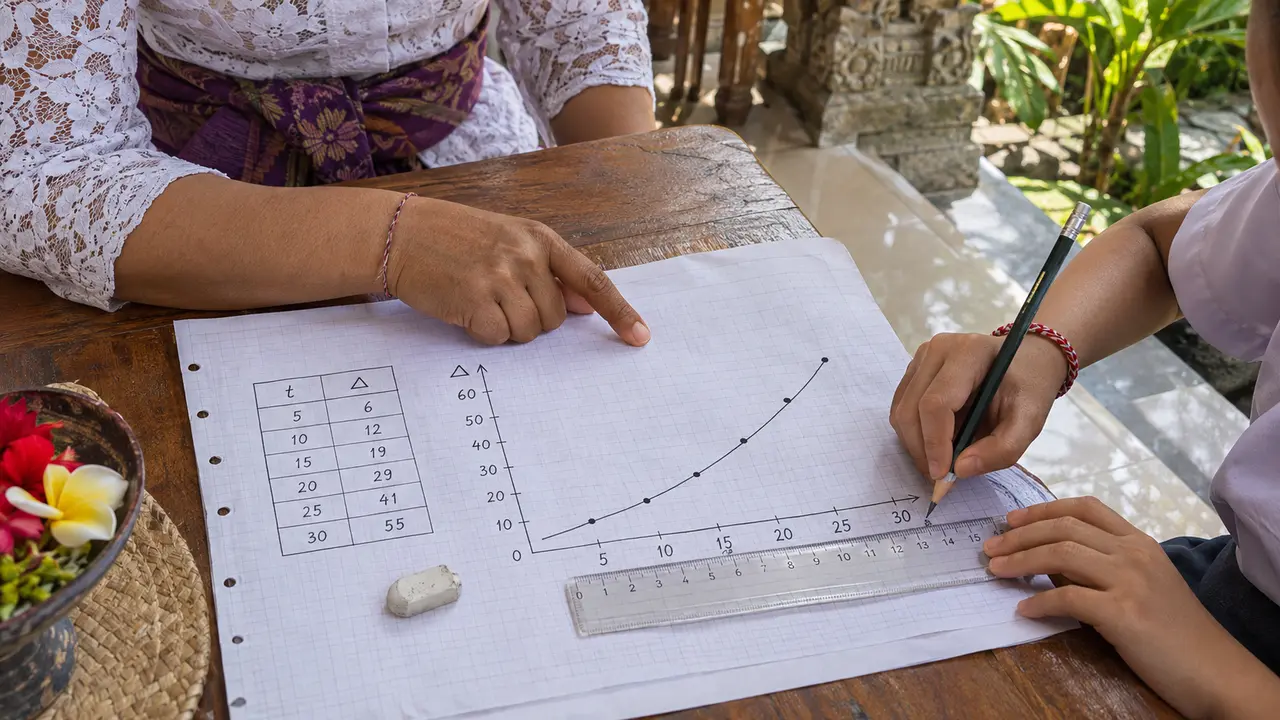
The second AI-generated image illustrates ruler-and-axis checking with fictional people; it records no actual lesson or client.
Find the smallest and largest value for each axis. Choose equal steps that cover the data and are easy to count, such as 1, 2, 5 or 10 units per large square. The graph does not always need to begin at zero, but a broken or shortened scale must be clear and must not exaggerate a difference.
Plot each coordinate by moving along x first and then up y. Use a small cross or precise dot. After plotting, compare every point with the original table once; this catches transposed coordinates before a line is added.
Choose the graph type from the variables
When both variables are numerical and one can vary continuously, a scatter or line graph is often appropriate. A line of best fit shows the overall relationship; it is not a dot-to-dot path unless the task specifically needs values joined in sequence. If the independent variable consists of named categories, a bar chart is usually clearer.
Finish with a meaning check. Point to one plotted value and say it as a sentence: “At 30 °C, the measured time was 42 seconds.” If the sentence does not match the experiment or the table, the axes or coordinate may have been reversed.
Get help with practical-science reasoning
If a learner can plot points but is unsure which variables, units or graph type the investigation requires, bring the results table and the exact syllabus to a science tutoring discussion.
Families arranging face-to-face lessons around Gianyar can also review the Gianyar tutoring area page. For the step before graphing, see independent, dependent and control variables.
Frequently asked questions
Does the independent variable always go on the x-axis?
It is the standard convention for most school investigations. Follow a different arrangement only when the task, subject convention or supplied graph explicitly requires it.
Should a science graph always start at zero?
No. The scale should cover the data clearly and use equal intervals. If an axis is shortened, make that choice obvious and avoid presenting the change in a misleading way.
Related
Message us on WhatsApp: +62 858 6969 6869 · info@privatetutoringbali.com · We reply within one working day.